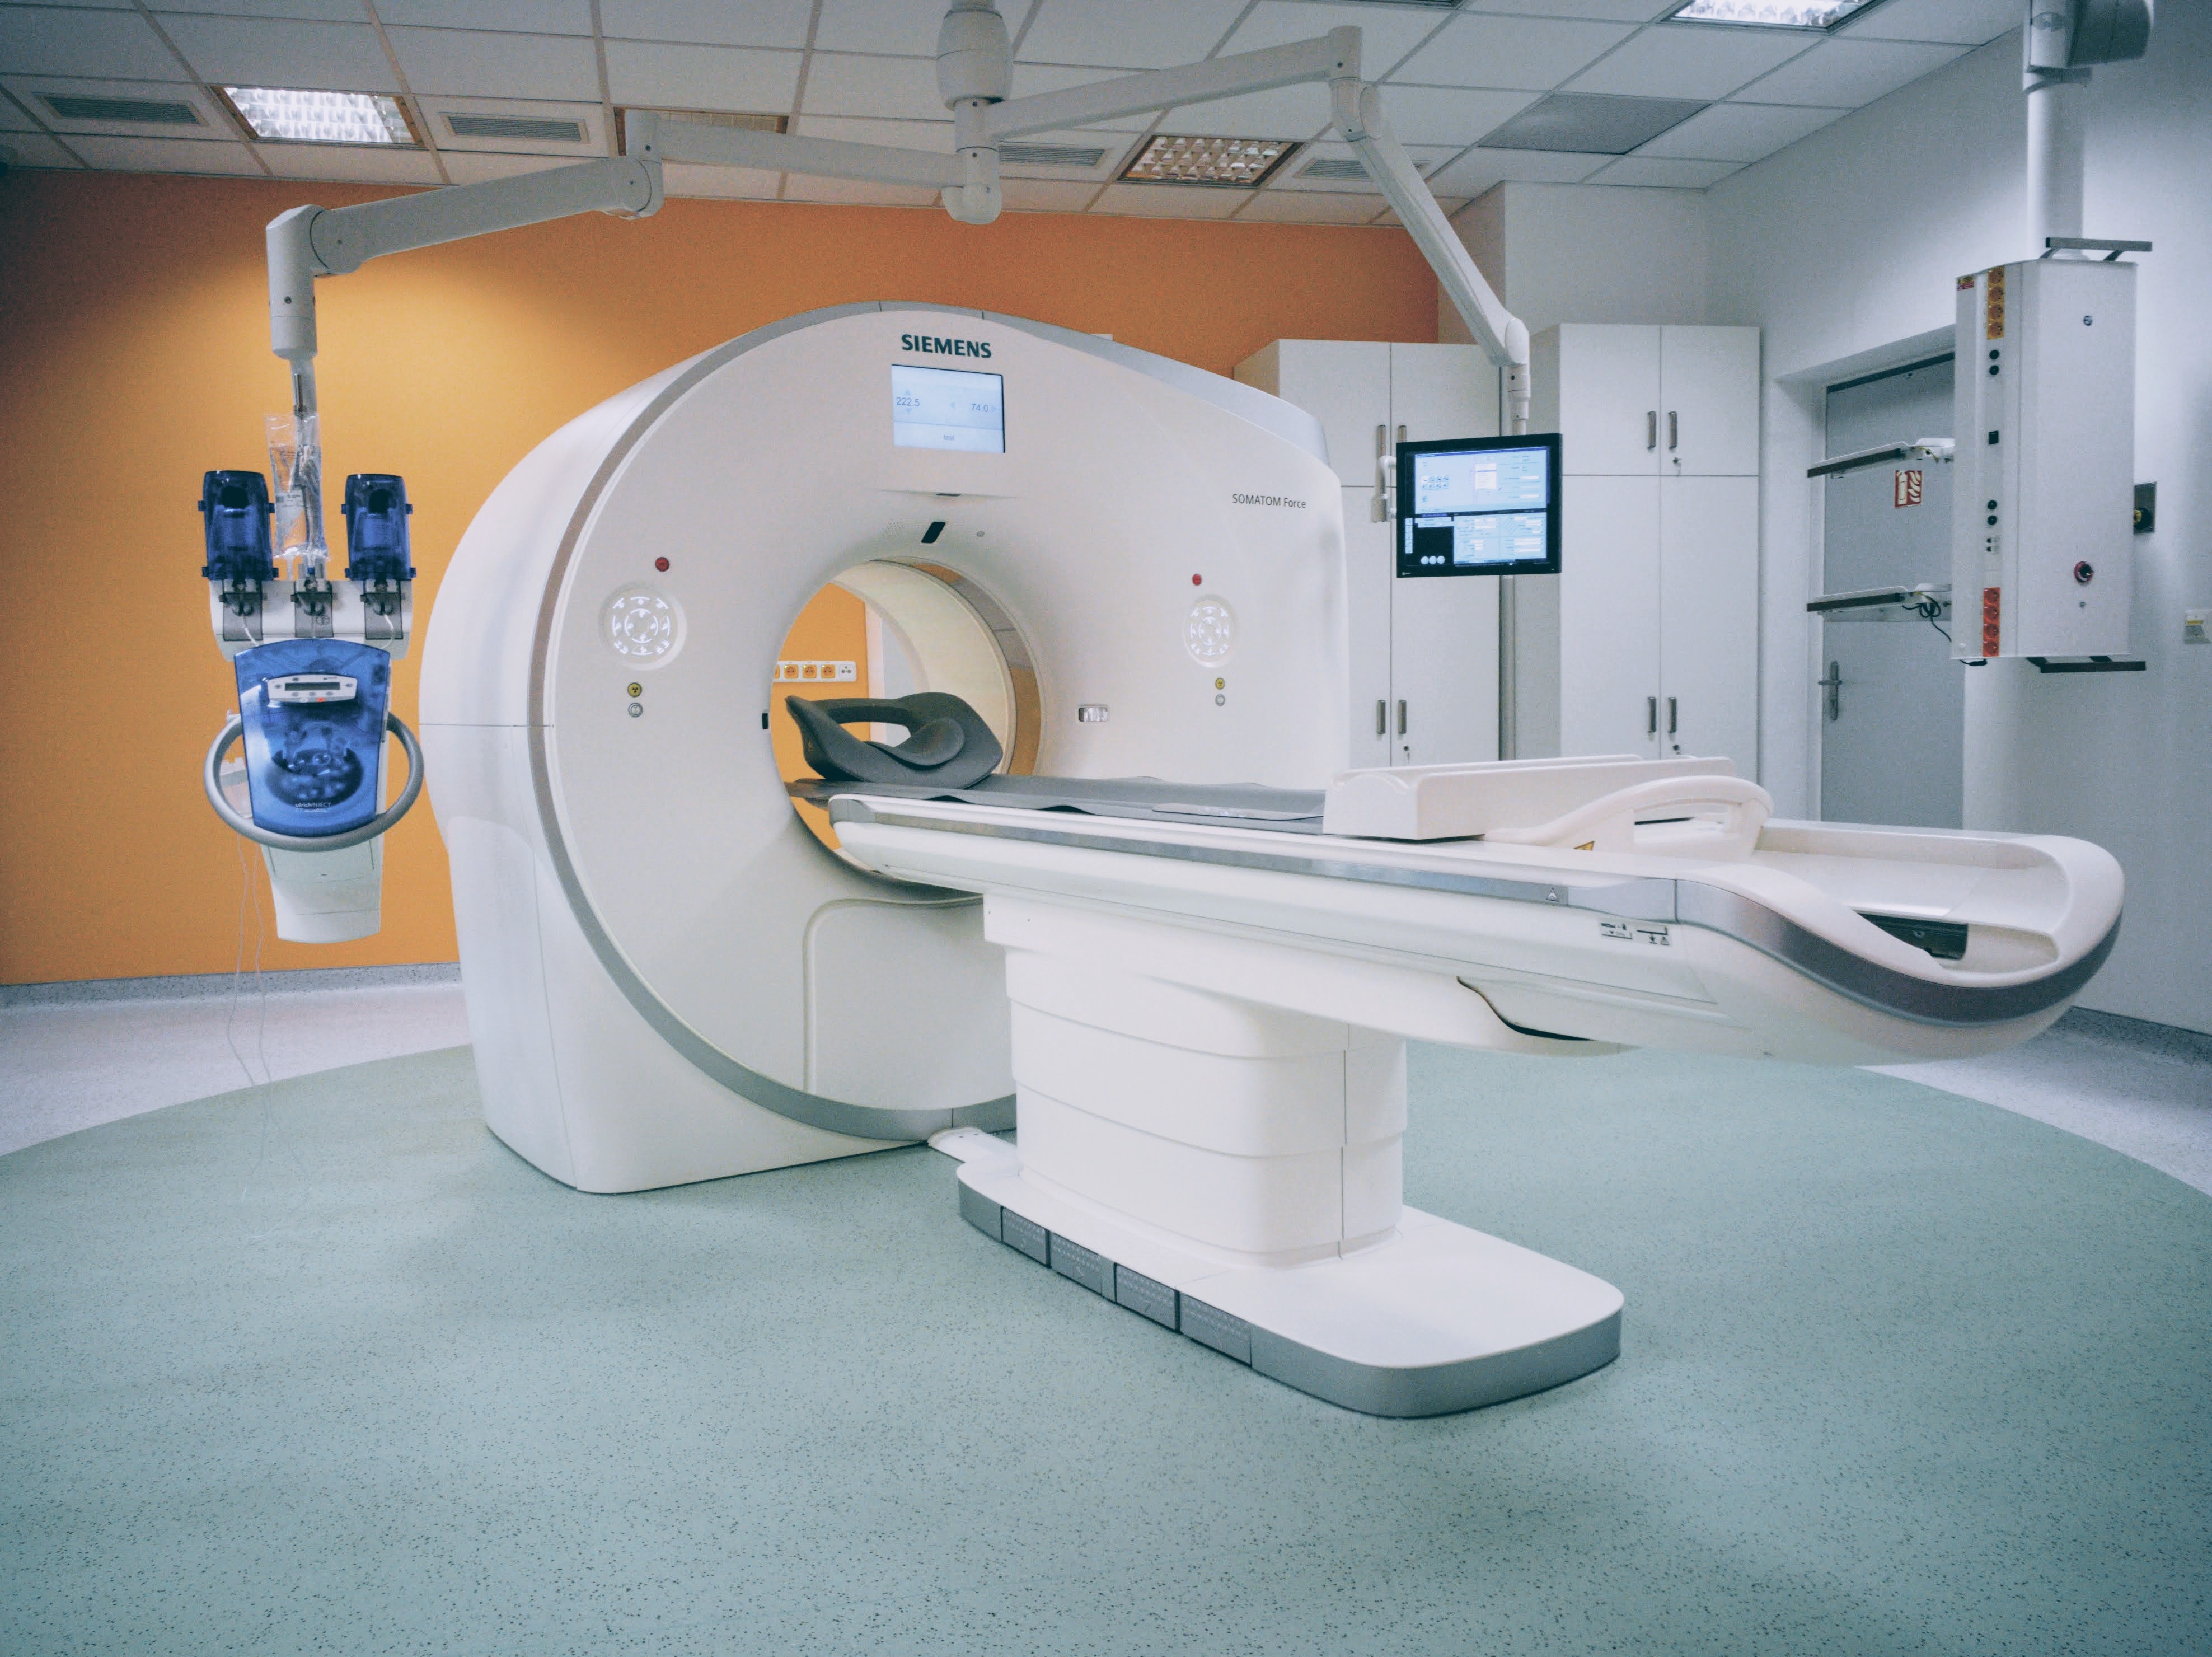
Computed tomography (Computed Tomography – CT) is a relatively well-known method from the field of medicine for the general public, where it finds application in the field of diagnostics. Computed tomography (CT) allows doctors to visualize the patient's body in cross-sections and make a more accurate diagnosis. Since the 70s of the last century, when CT entered medical practice, there has been a rapid development of computing technology and its availability to other fields of science and industry. This is where CT appears as industrial tomography or CT scanning and is now an indispensable method of non-destructive testing and quality control.
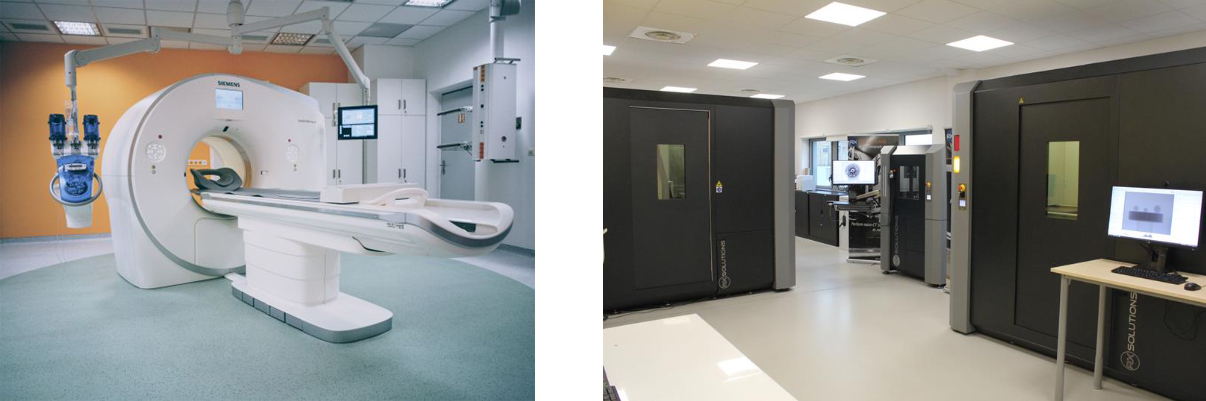
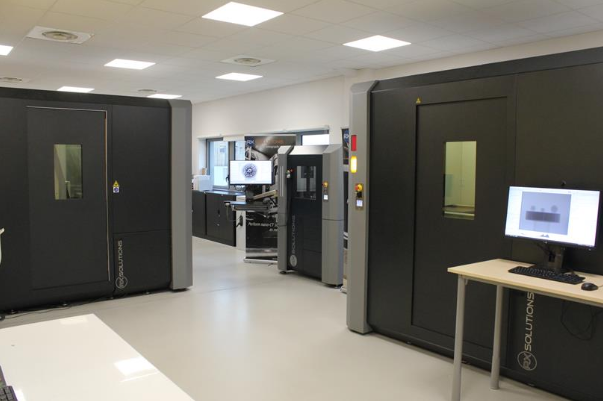
Medical CT and its office modifications commonly available today for industrial and scientific purposes.
In translation, tomography means imaging in sections (Greek tome-cut, graphein-write). Thus, without external intervention, it allows us to literally see inside the body of an object, sample or 3D scan an optically inaccessible space. How is it possible?
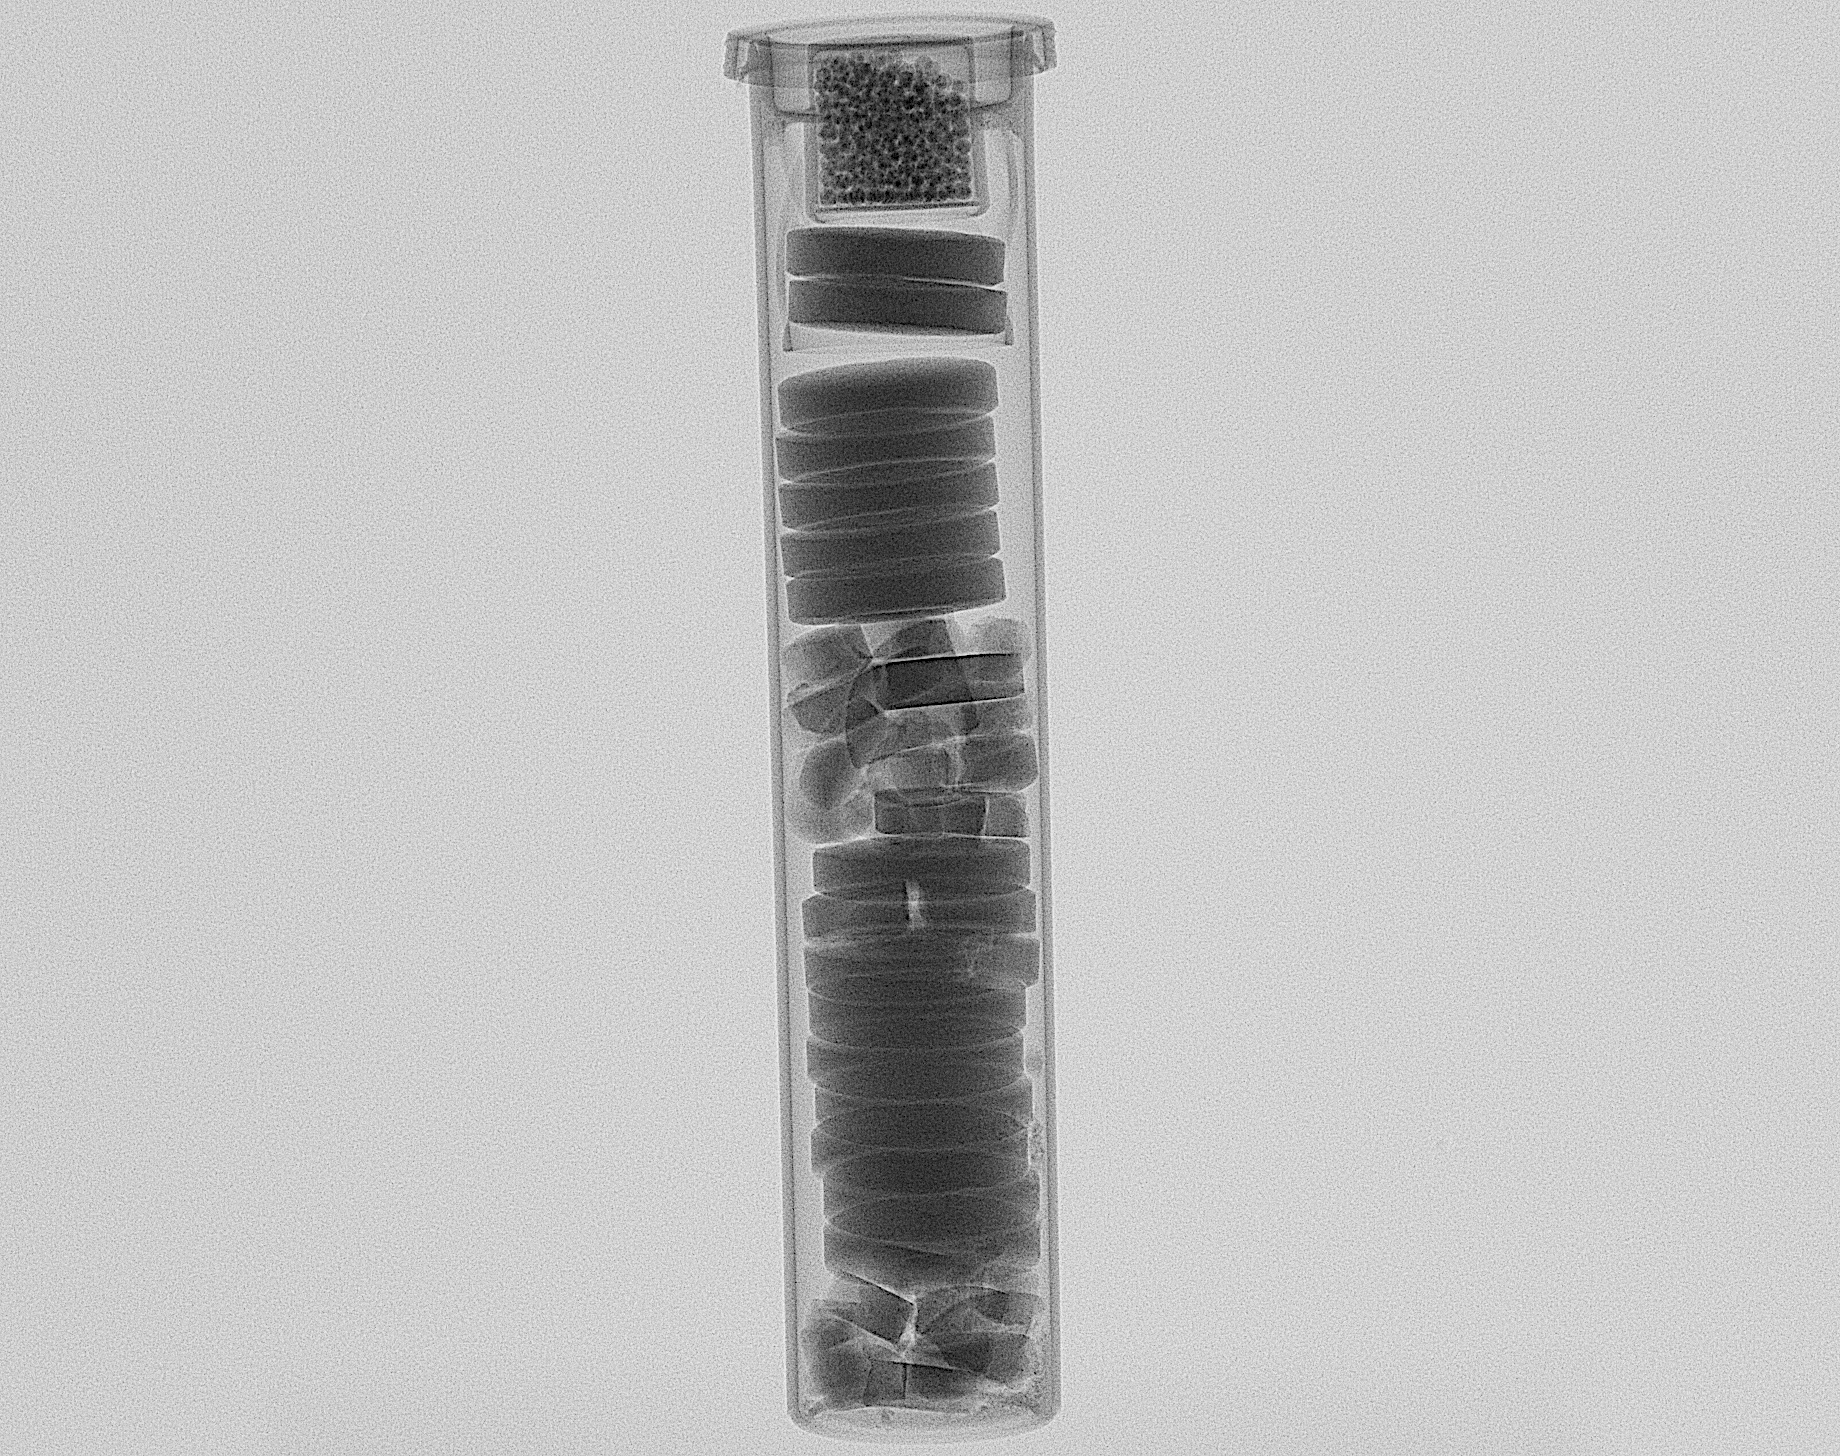
A CT uses an X-ray source and a sensor to capture radiographic images. Such as you know from a doctor when establishing a diagnosis, for example, of a fractured limb. This imaging principle is called radiography and is created by passing X-ray radiation through the sample and capturing its image on the display screen. Unlike light, X-ray radiation has sufficient energy to pass through an object without reflection. The attenuation of X-ray radiation increases with the density of the material, so we see dark and light spots on the resulting image (according to the density of the material in the beam path). X-rays are converted into visible radiation in the detector and digitized. Each pixel on is assigned a grayscale value at a given bit depth according to the attenuation.
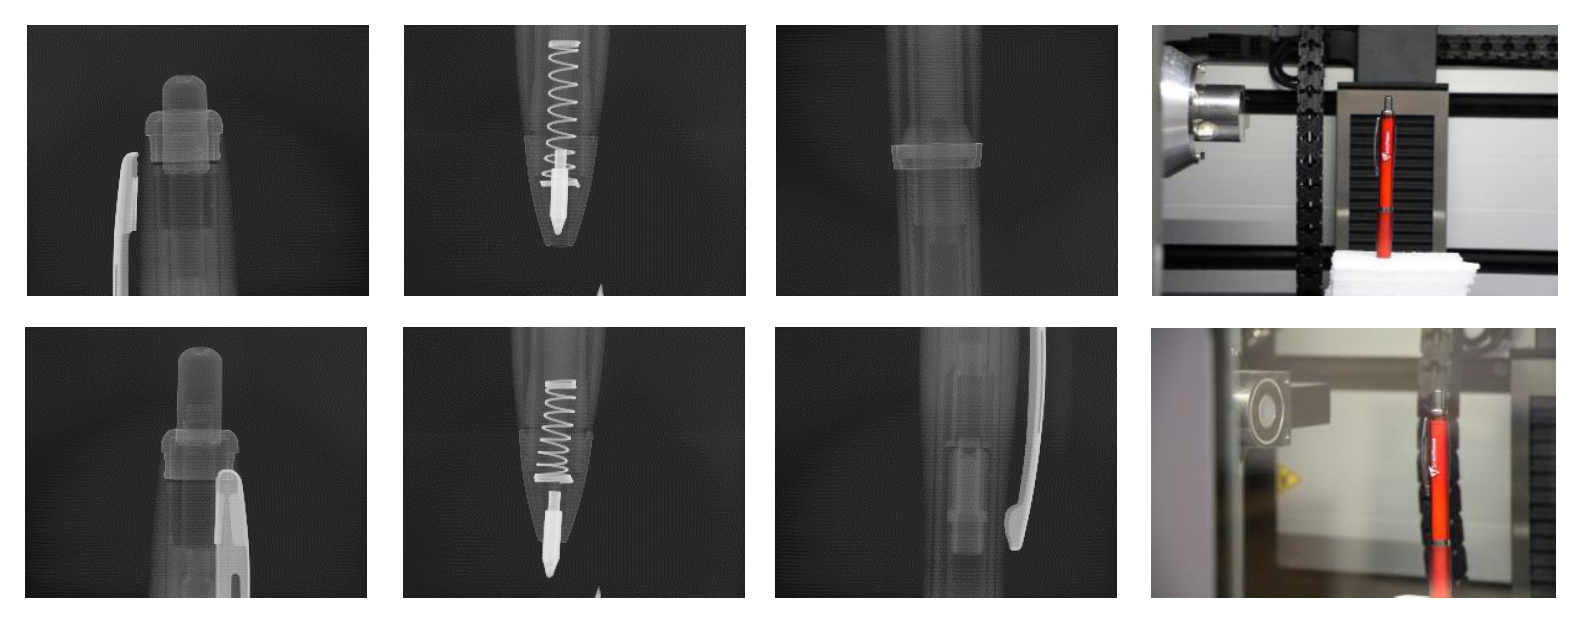
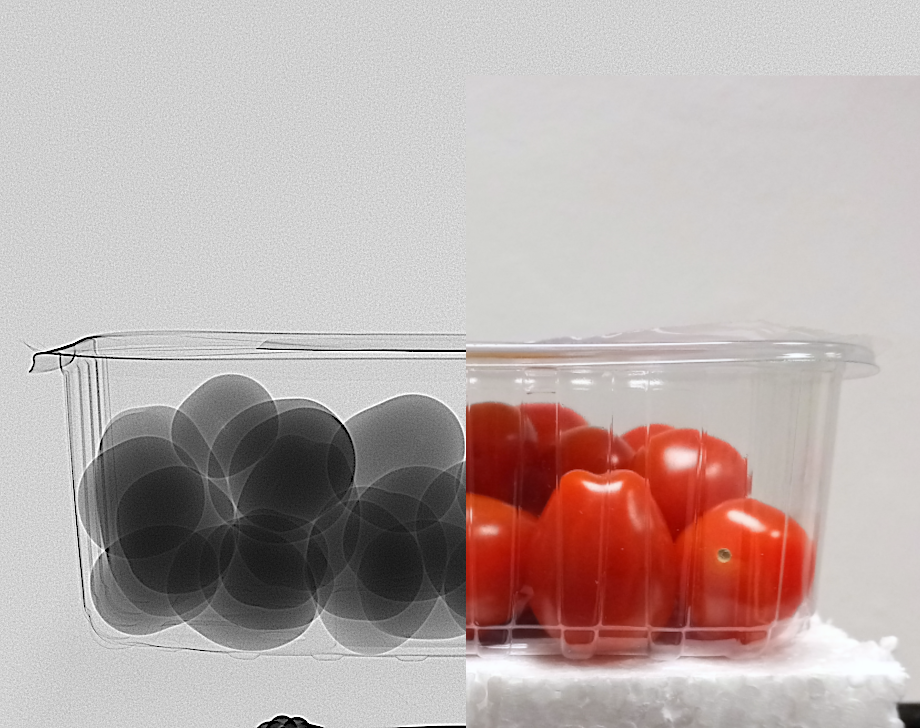
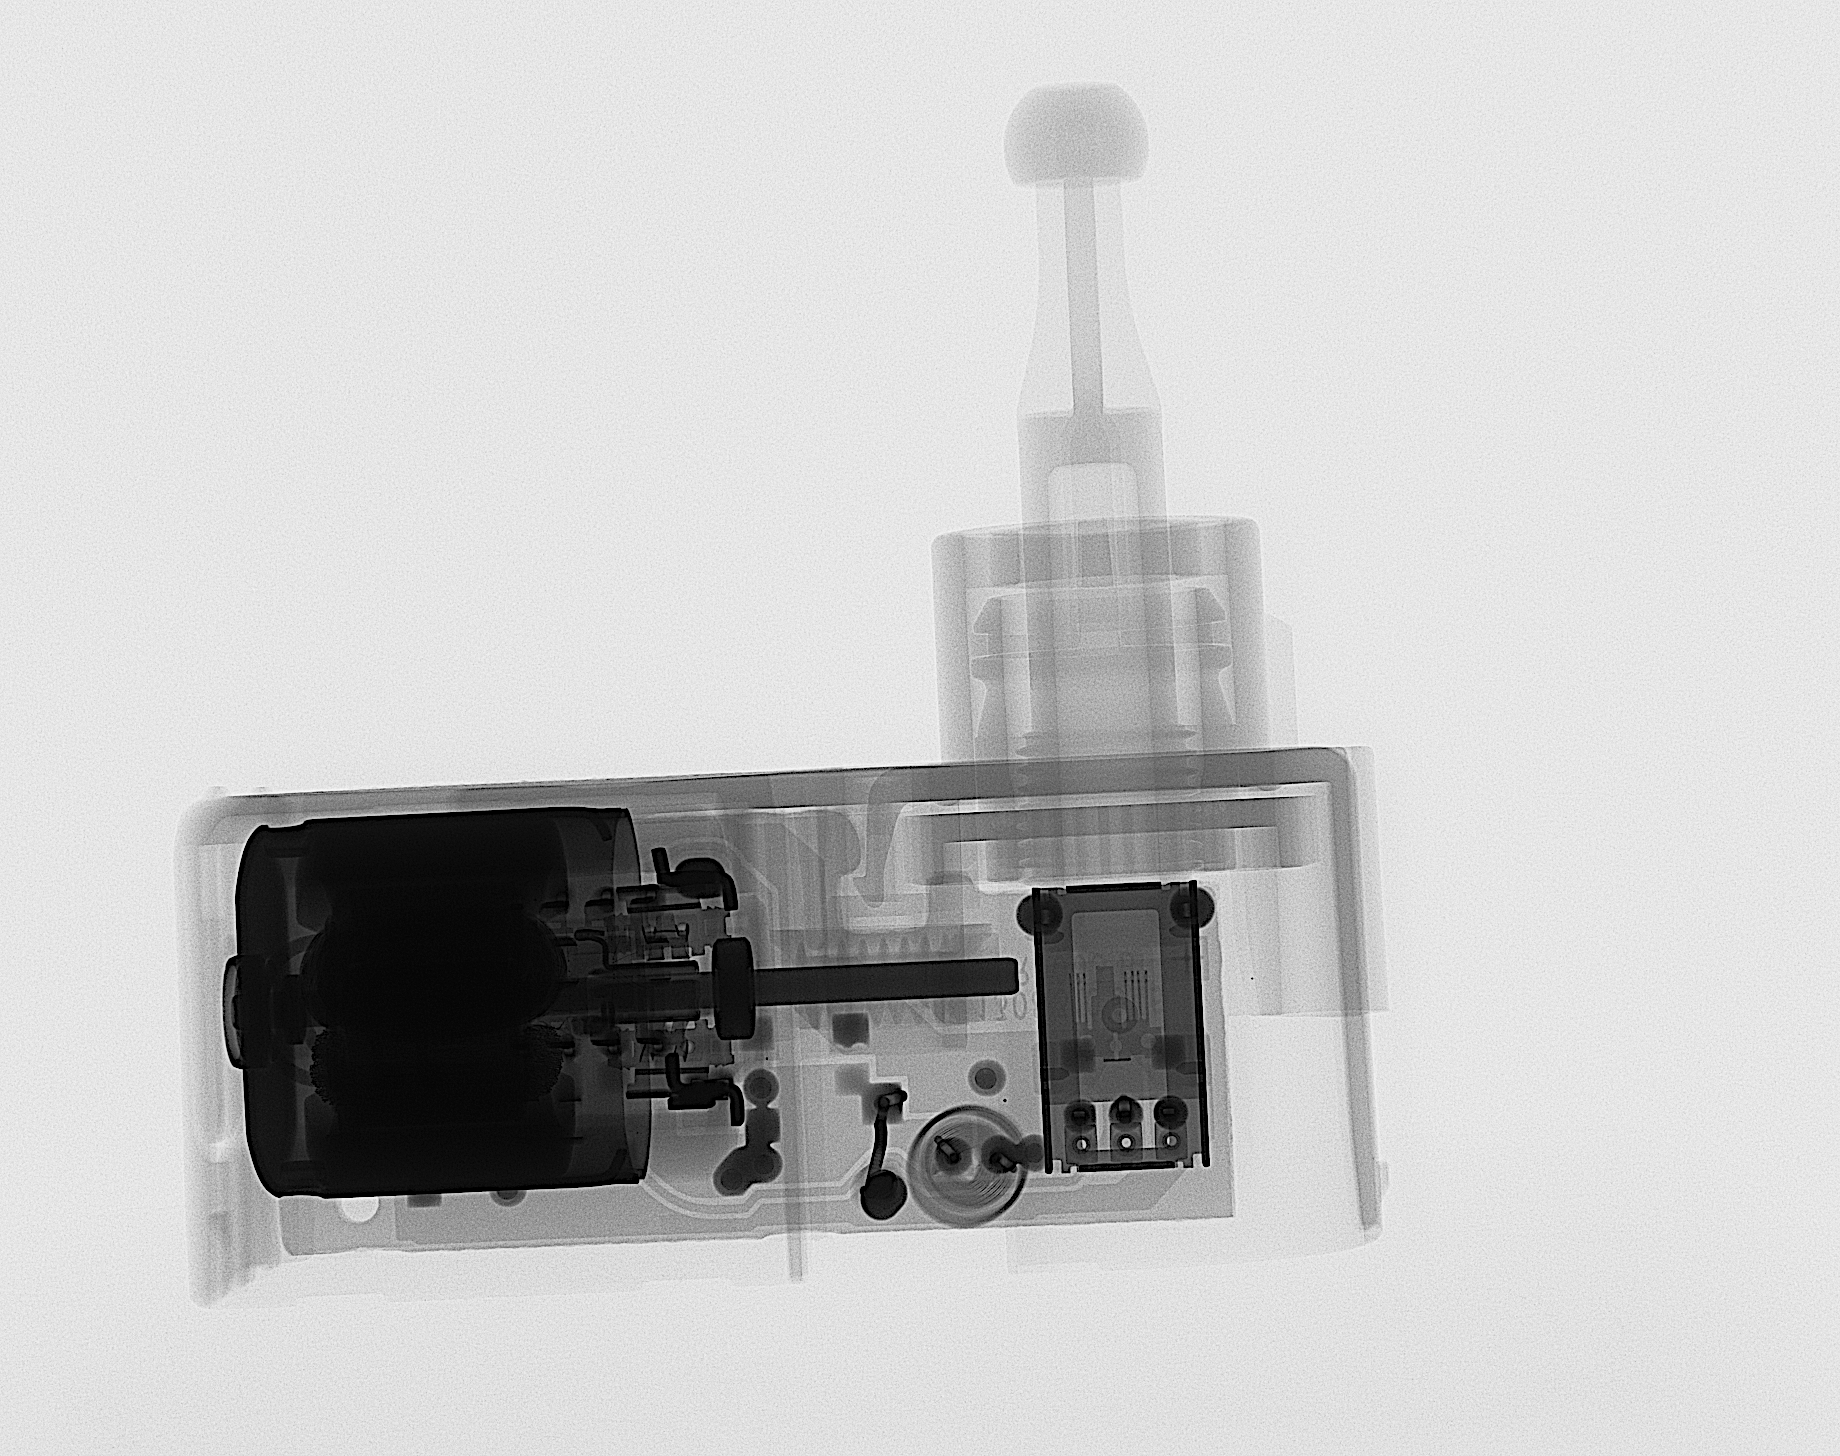
In this first phase of CT, radiographic imaging, we can use this simple principle of imaging to inspect the sample, assemblies, defects, but also food, etc. in real time and reveal the defects and defects we are looking for.
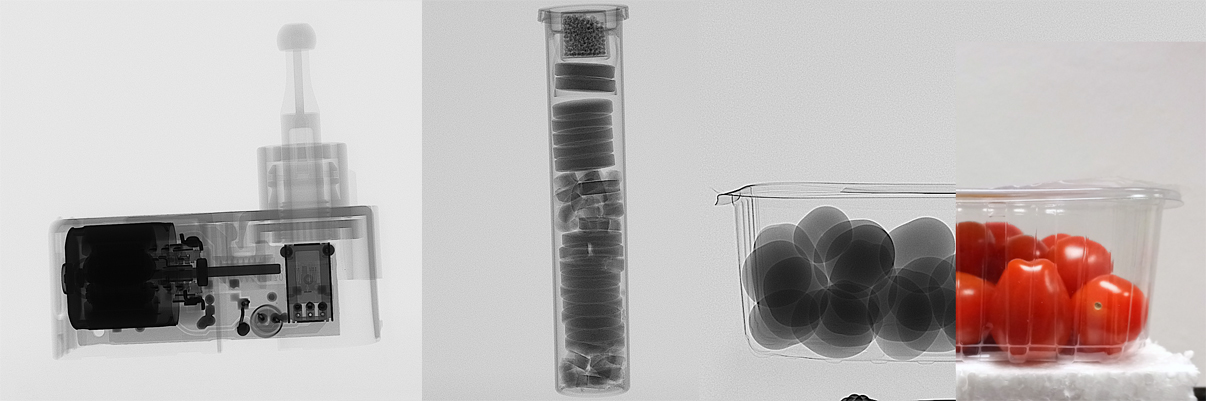
Just by shining a light on the object, we can immediately obtain valuable information that can lead to the solution of the given problem
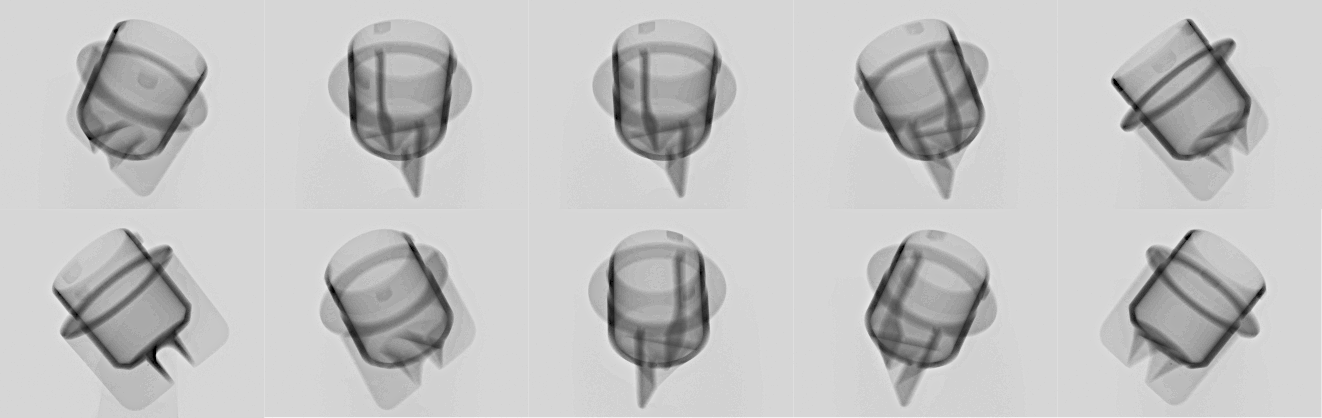
If we place the sample on the turntable, we can use radiography to obtain a set of 2D images of the objects in its 360° rotation. The resulting 3D model can then be reconstructed from these. For a good result, it is necessary to take hundreds and sometimes even thousands of such pictures. The condition of rotation of the sample in the shielded inspection chamber of the tomograph largely determines the maximum size of the scanned object, as well as the power of the X-ray source must be sufficient to irradiate the sample and obtain quality images.
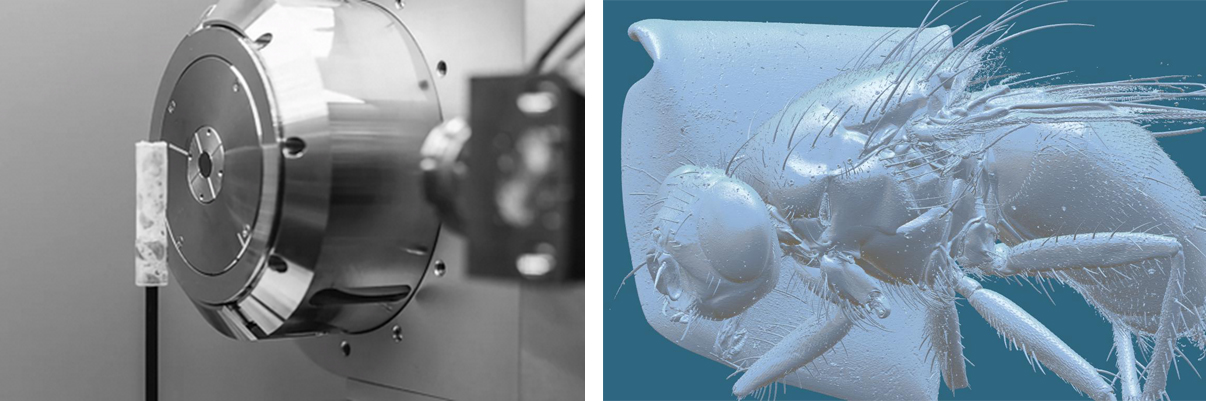
The inspection chamber of the small X-ray tomograph with the source (1), the sample (3) on the turntable (2) and the sensor/detector (4). A set of radiographic images for the filtered back-projection reconstruction process.
The shadow image on the detector is displayed with the appropriate magnification, which determines the focal distance of the object from the X-ray source. Thanks to this, we can achieve sub-micron resolution and scan very fine, microscopic structures and objects for very small samples in close proximity to the X-ray machine.
After the first phase of obtaining a set of radiographic images of the object, the so-called acquisition, the reconstruction process follows, during which a 3D model is created from these images. During the reconstruction process, the key principle of CT is the mathematical application of the so-called filtered back projection. It is an inverse Radon transformation algorithm, which fills the entire space with each individual projection, and after adding them up, the noise is filtered out.
On the left, an object with a rotating source of X-ray radiation and a detector on which we can see changing attenuation values. This is represented in the middle by the so-called sinogram. On the right, the original section is simultaneously reconstructed from the given sinogram using filtered back projection (FBP). Source: Samuli Siltanen (University of Helsinki)
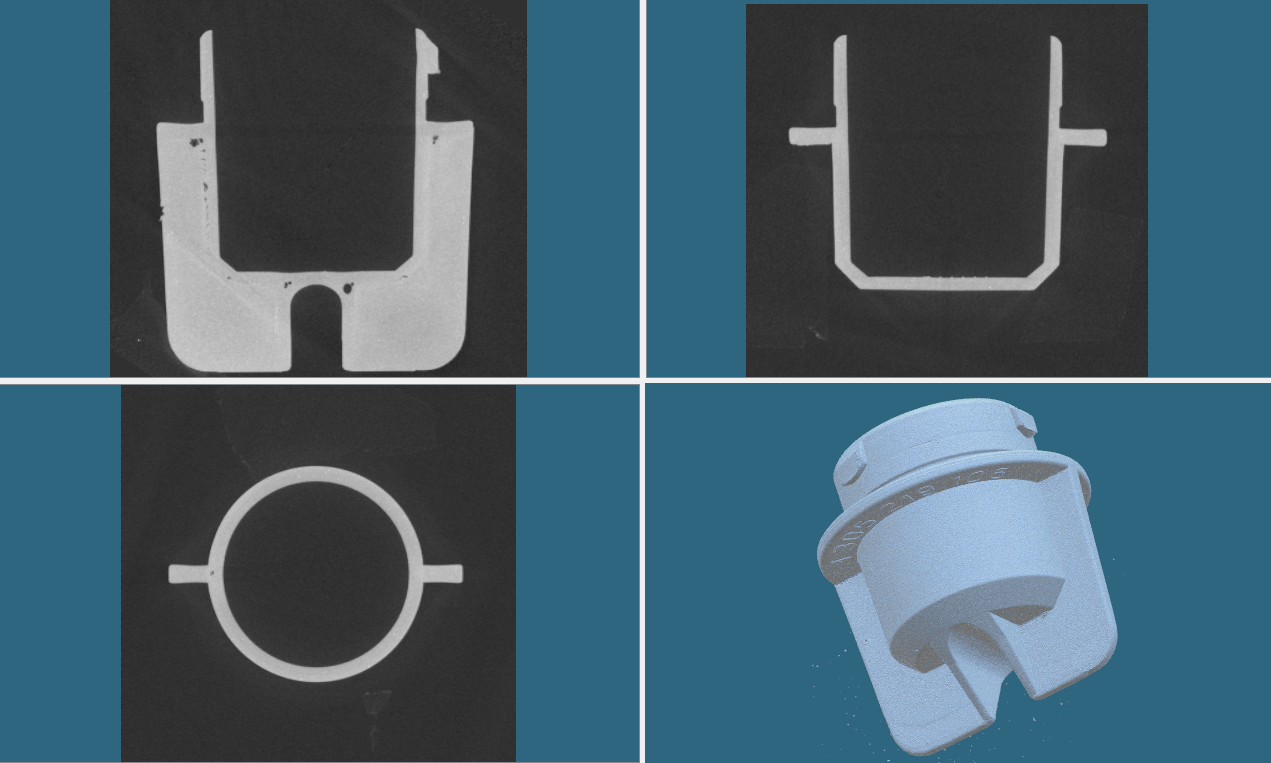
3D object after reconstruction shown in sections in individual axes
After the reconstruction, we get a 3D object with sections in the individual axes X, Y, Z of the given coordinate system. Unlike other optical methods of 3D scanning, where the output is usually a polygon network (.stl, .obj), i.e. only information about the visible surface, in CT scanning the object is displayed using so-called voxels (volume elements). Each voxel is assigned a grayscale value at a given bit depth according to X-ray attenuation. The boundary (object/space), i.e. the surface of the reconstructed model, determines the threshold level setting (treshhold) for the surface determination process. The easiest way is to use the middle between the average value of the background and the material (ISO50). It then determines what will be the object and what will be the space. (It must be added that in practice we use more advanced methods.) In the end, we get a model with a precisely captured geometry of a complex surface, but we still have at our disposal the entire body of the object composed of individual voxels, each of which carries its own information. It is this that makes CT one of the most powerful tools for non-destructive analysis and testing.
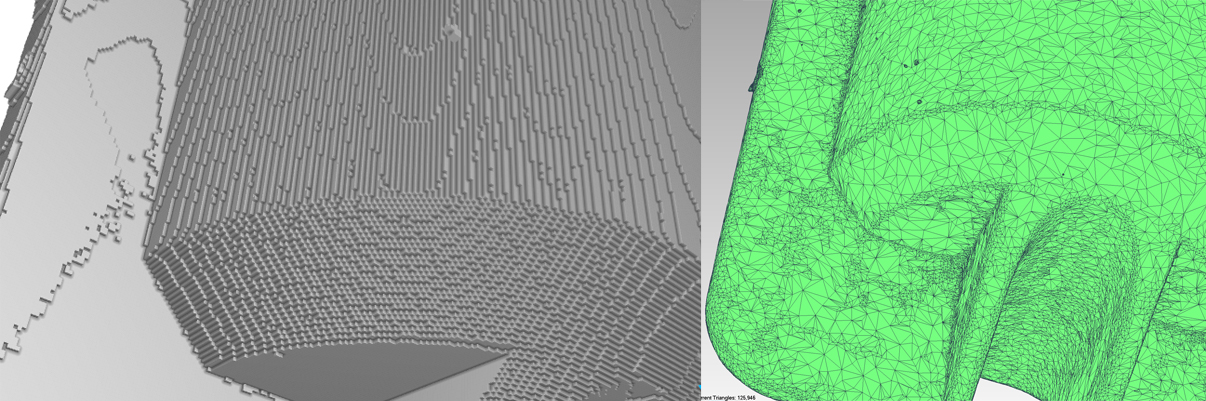
Illustrative (simplified) visualization of differential representation using voxels and polygon mesh. On the left, a volume model made of voxels, on the right, a surface model composed of a triangular mesh.

Resulting surface after advanced surface determination using values of surrounding voxels.
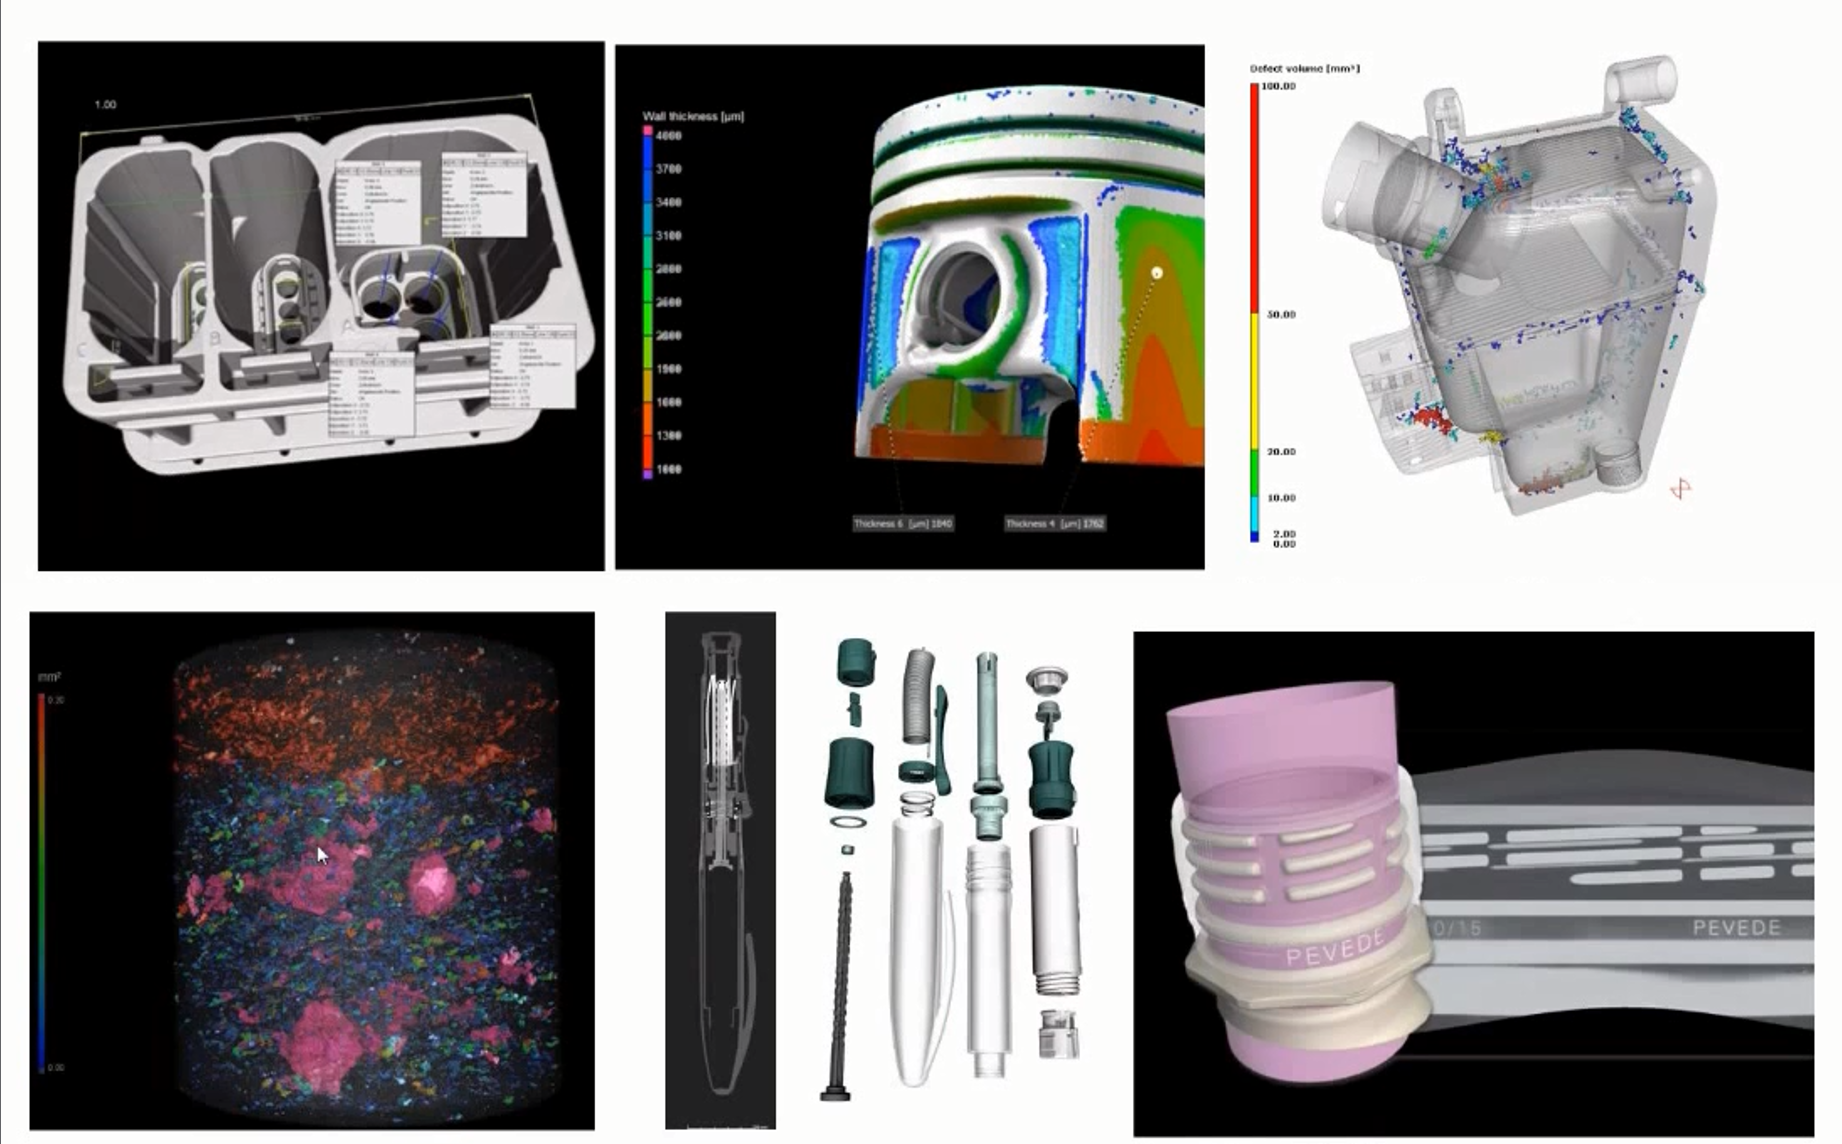
The uses of CT are more or less the same as those of laser and optical scanning. It is therefore mainly used in dimensional control, but also for prototyping and digitization. However, in the case of industrial computed tomography, the field of application expands to include a whole range of areas that result from the use of voxel representation (capturing the internal structure) for subsequent analyzes and simulations.
The results obtained in this way can be used to evaluate (visualization, color map, histogram, statistical evaluation .. ) porosity/inclusions, comparison with CAD model, wall thickness, fiber orientation, structure of porous materials, strength and flow simulations, but also impressive visualizations using segmentation.
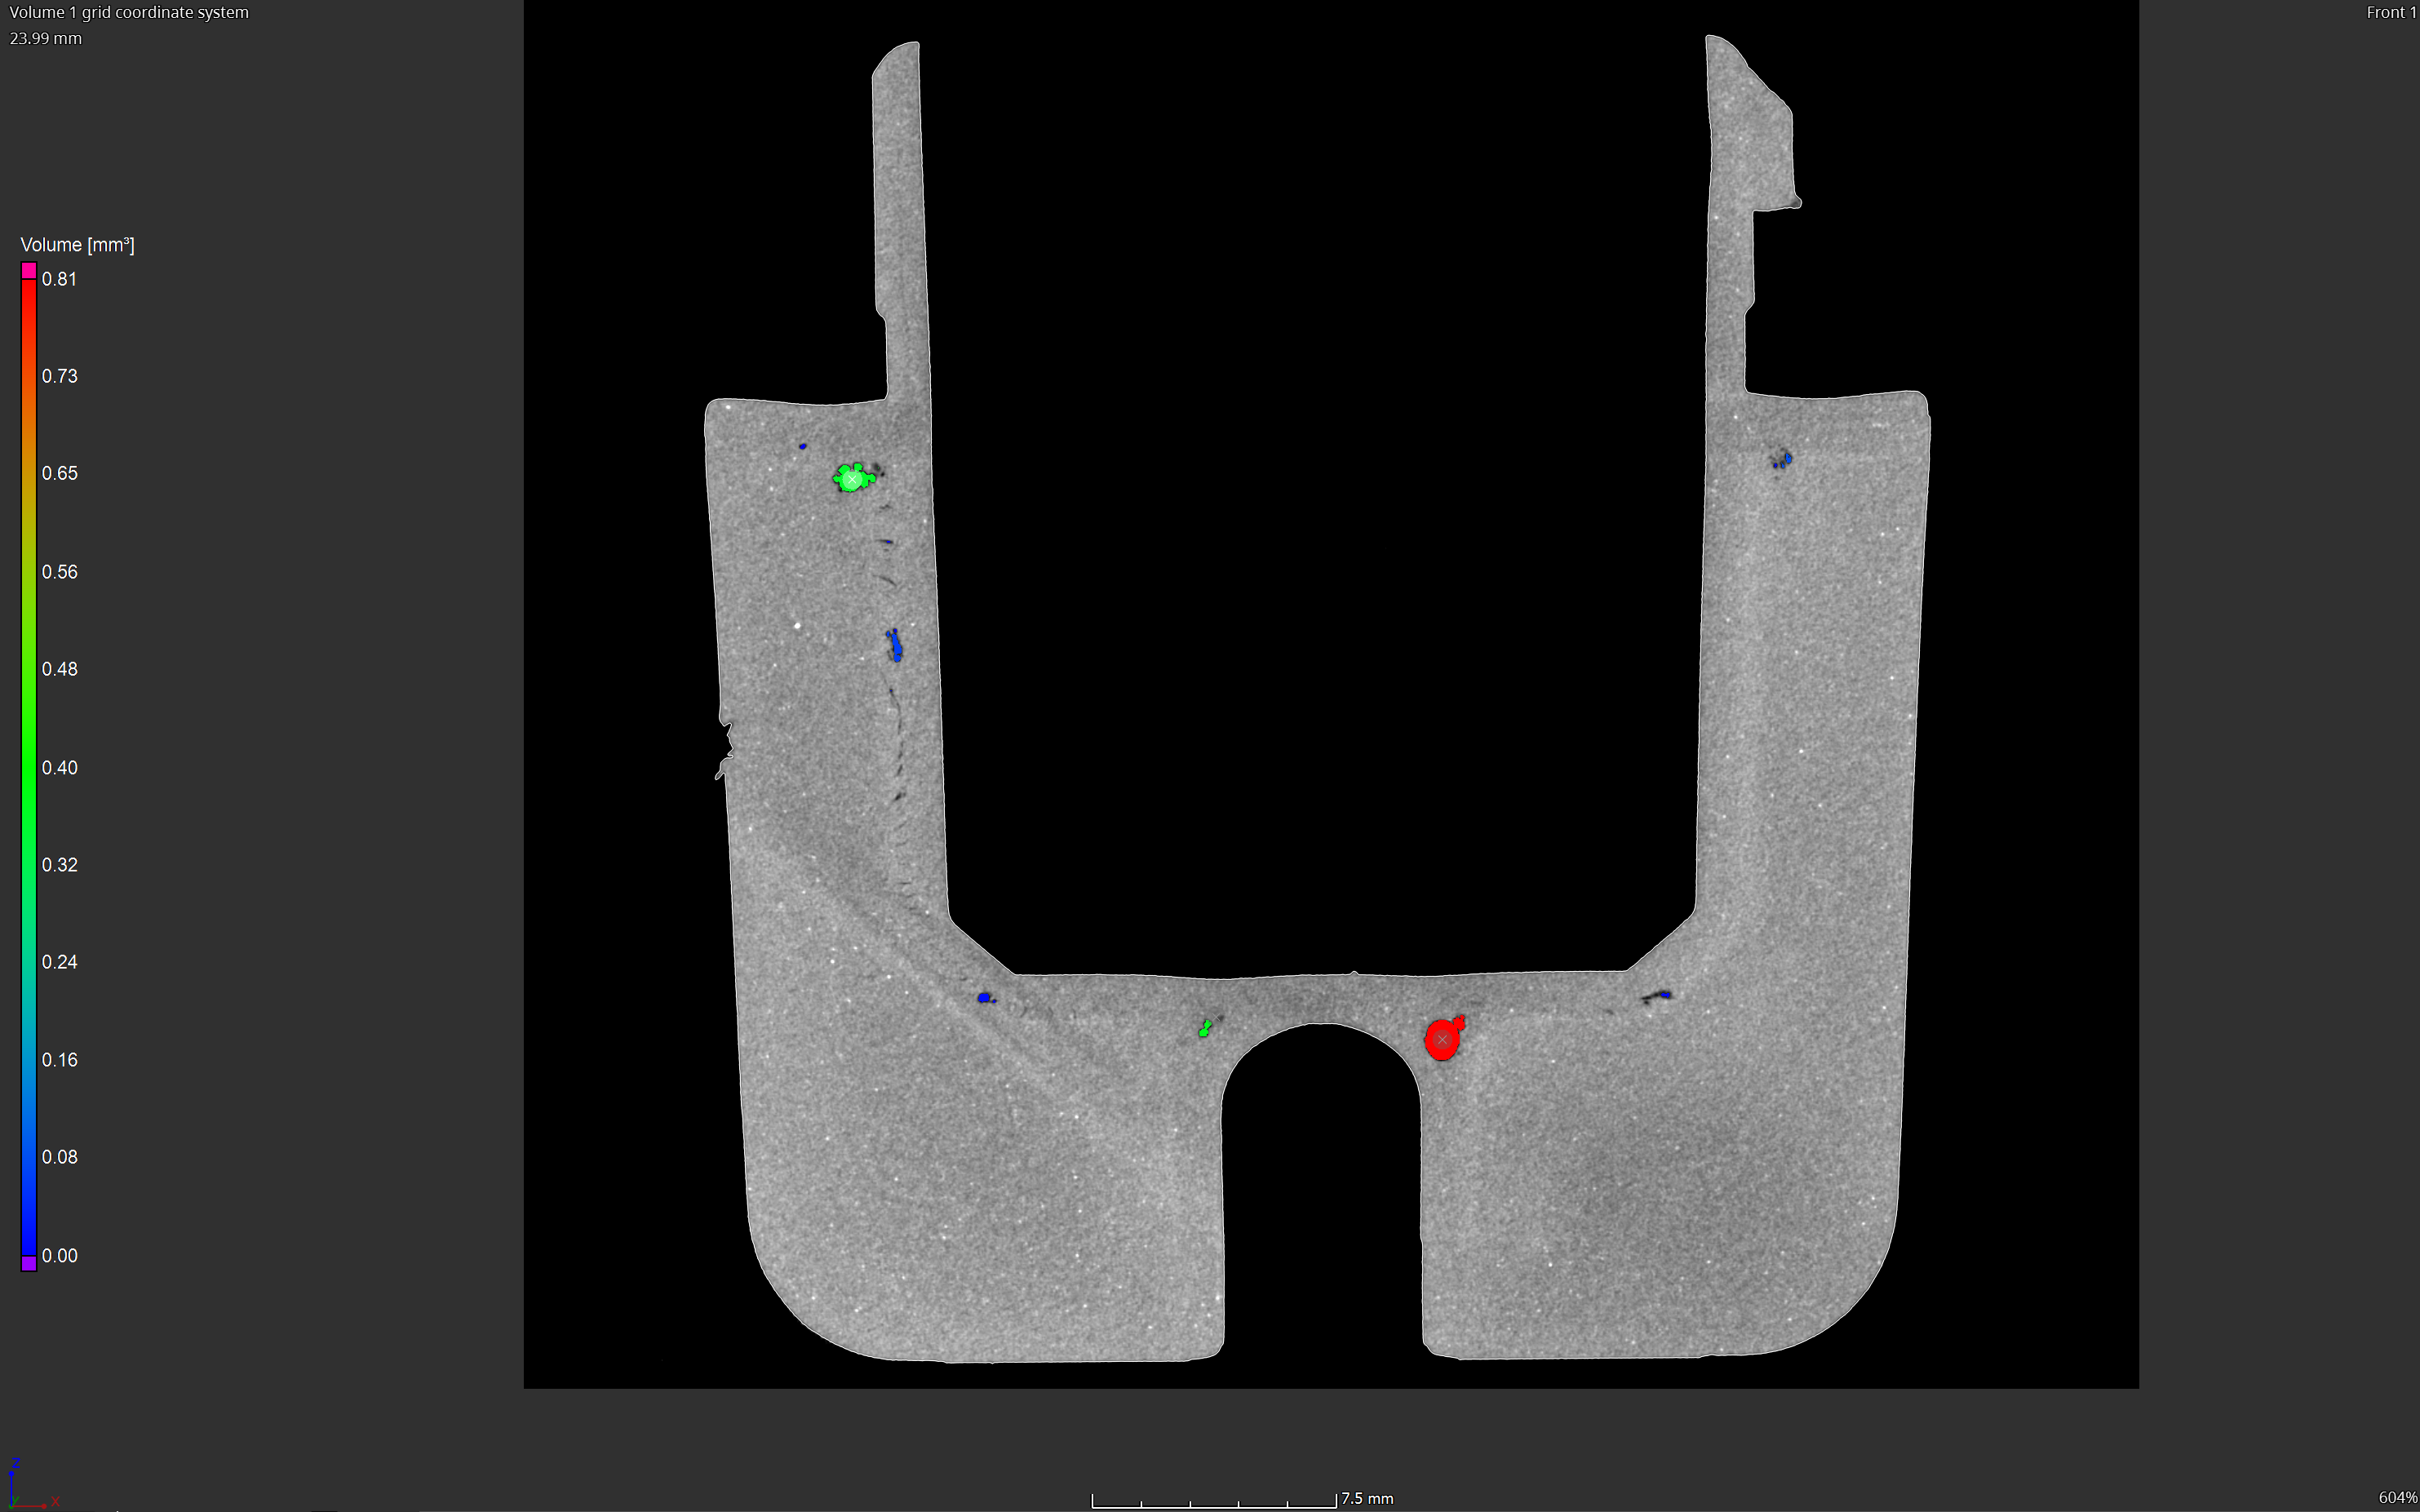
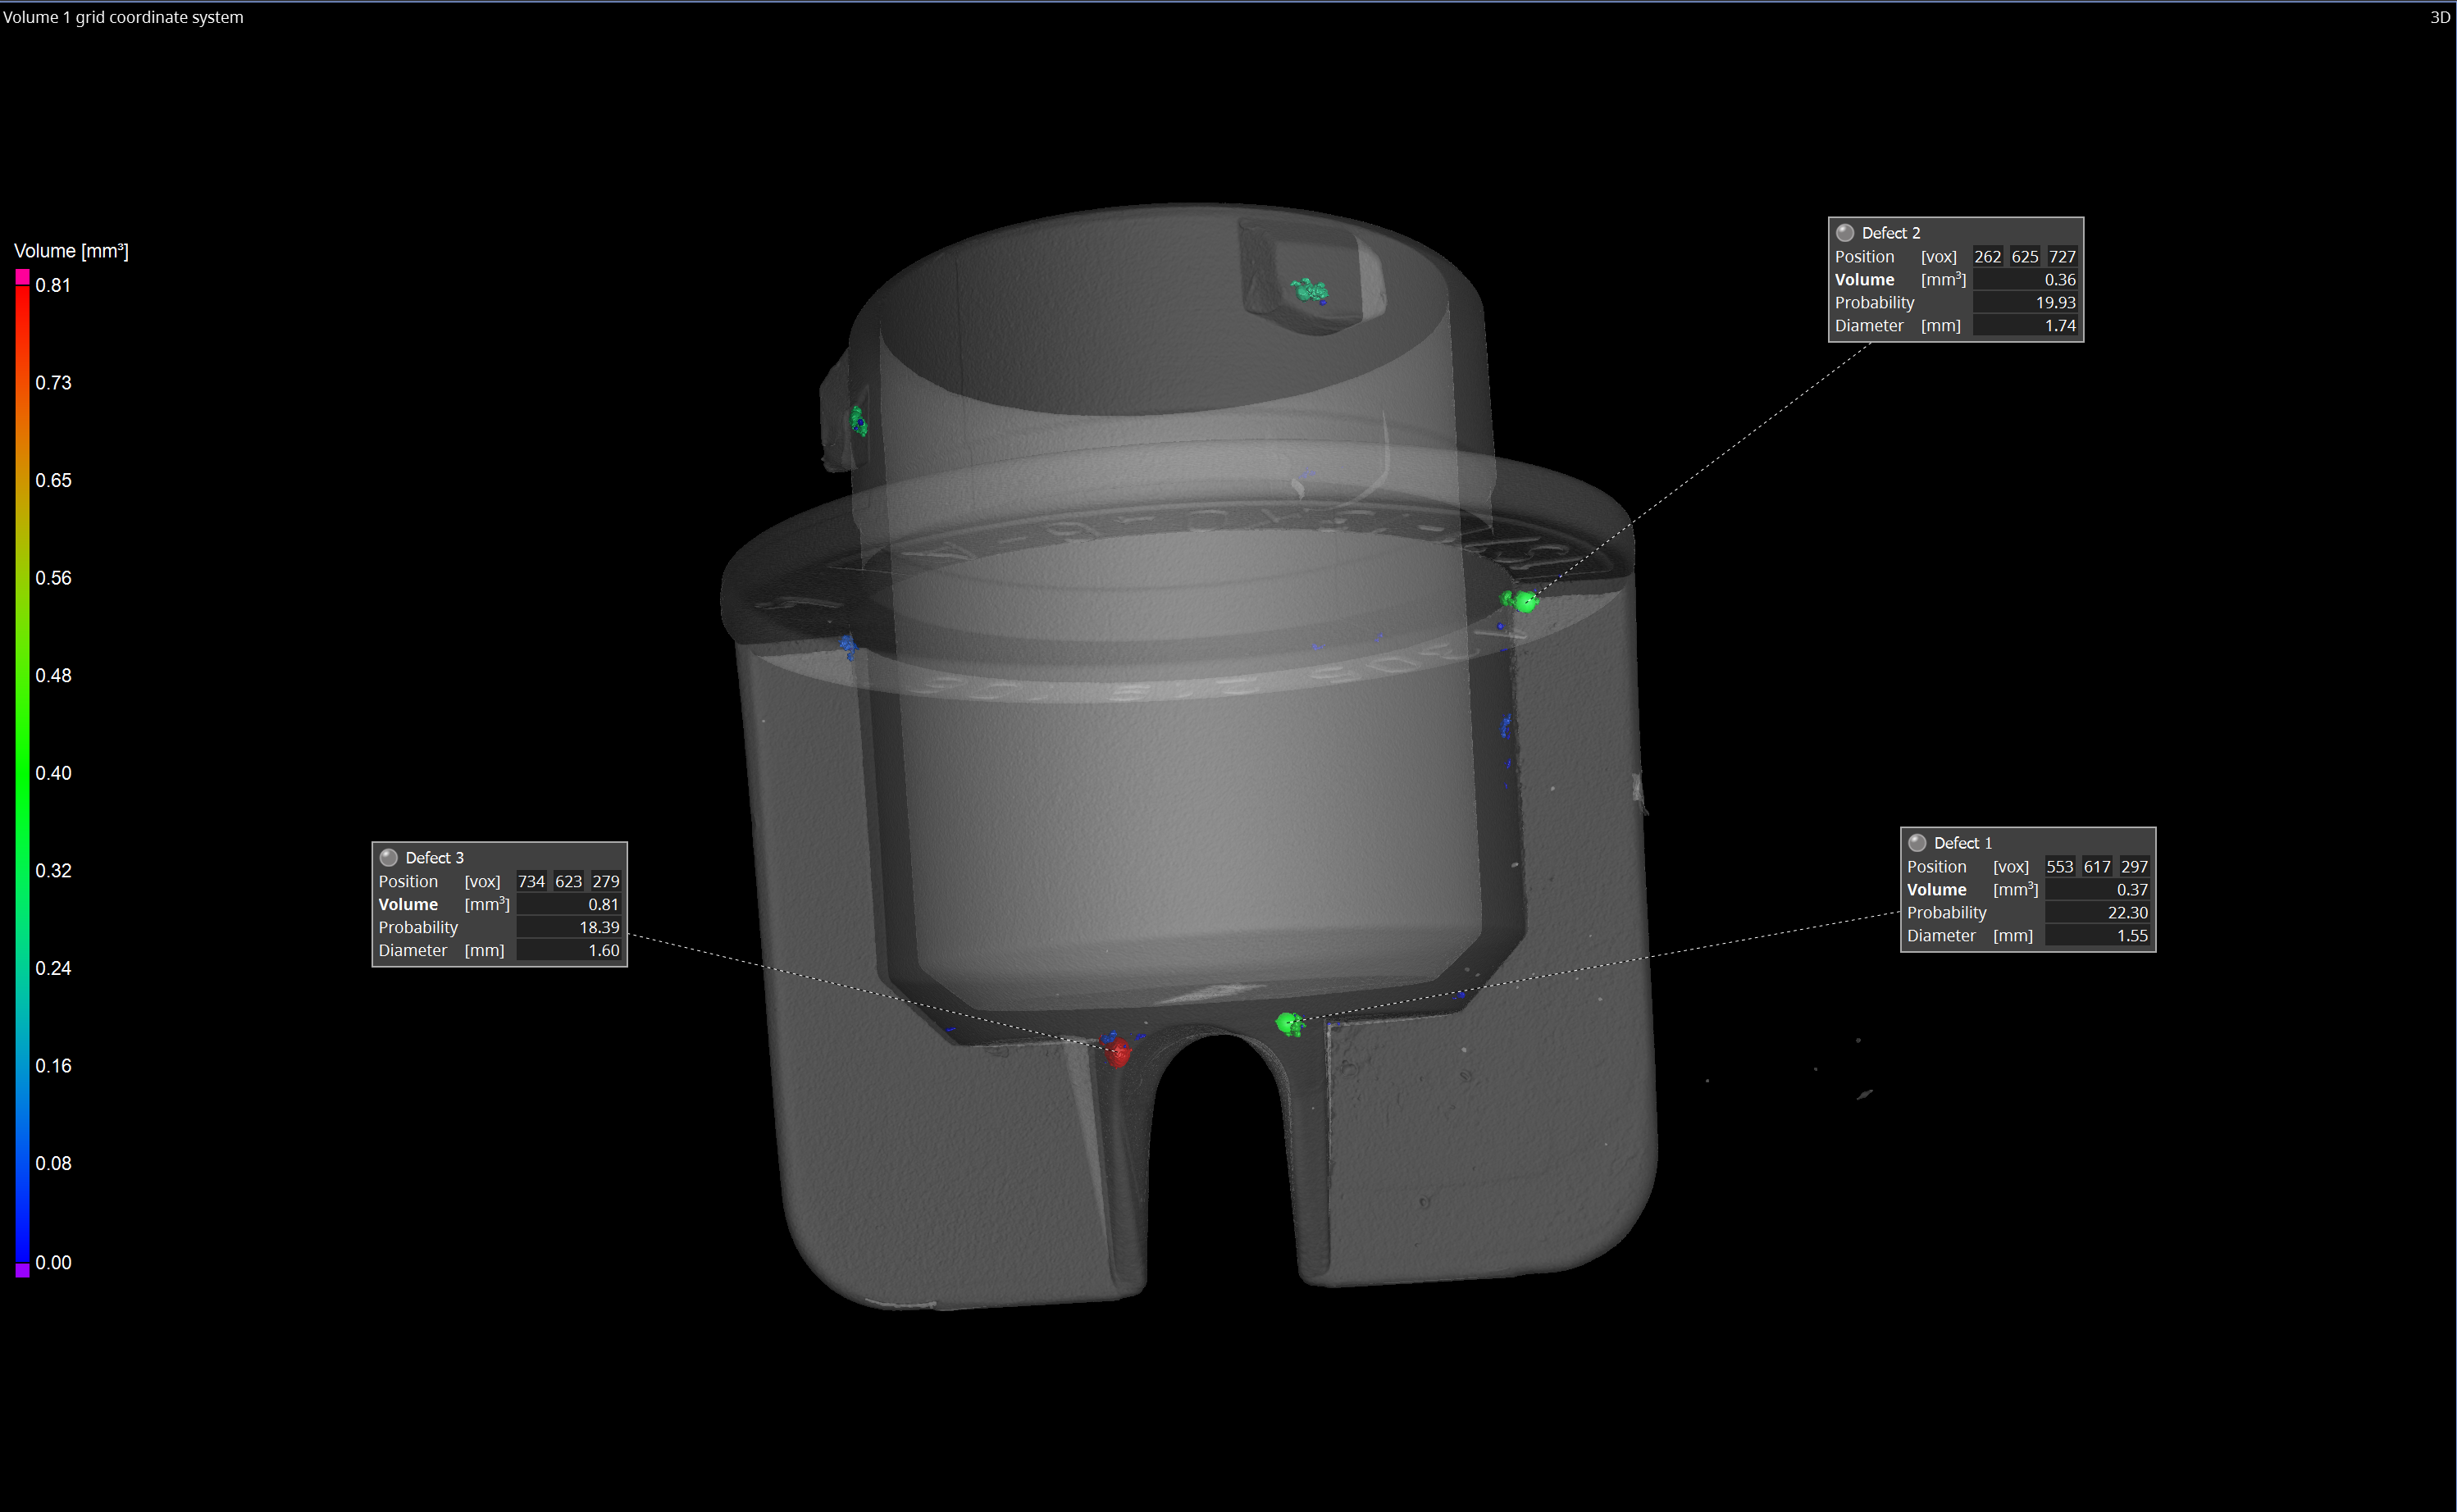
Detection of the 3 largest pores in the VG Studio MAX program
Computed tomography is an effective tool for inspection, development and research, for example in the automotive and aerospace industries, additive manufacturing and various areas of mechanical engineering, where we need to use non-destructive, non-invasive methods of analysis and quality control. Among the areas of scientific disciplines, it is about using the advantages of microtomography also, for example, in biology, geology, archeology or paleontology. In a number of scientific experiments, in situ scanning is also used, i.e. scanning a sample under specific physical conditions (temperature, pressure, vacuum, etc.) in specially adapted preparations. As is clear from the above, the possibilities of computed tomography are enormous. We can also assume that with the development of new types of sensors and advancing automation, industrial CT will appear more and more often in various applications.


Headquarters
SolidVision, s.r.o
Josefy Faimonová 11a
628 00 Brno
CIN: 26280442
VAT: CZ26280442
Prague branch
Zábehlický castle
Behind Potok 46/4
Runaway
106 00 Prague 10


